ALDS, NLDS X-factors: One element that could swing Dodgers vs. Phillies, Yankees vs. Blue Jays and more
These details could very well decide who plays for the pennant in the 2025 MLB postseason

Major League Baseball's 2025 playoffs continue Saturday with the four Division Series matchups. These best-of-five sets will determine which teams advance to play for the pennant, thereby setting the stage for the 2025 World Series.
Anytime MLB is set to embark on a new playoff round, CBS Sports makes a point of highlighting one X-factor in each series that could swing the outcome. You may ask yourself: what, precisely, is an x-factor? My answer: it's whatever I want it to be. Whether it's an obvious dynamic or something hidden in granular data, I'm willing to include it if I think it could play a big role.
With that out of the way, let's get to the x-factors that could dictate the Division Series.


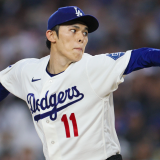
Los Angeles Dodgers vs. Philadelphia Phillies
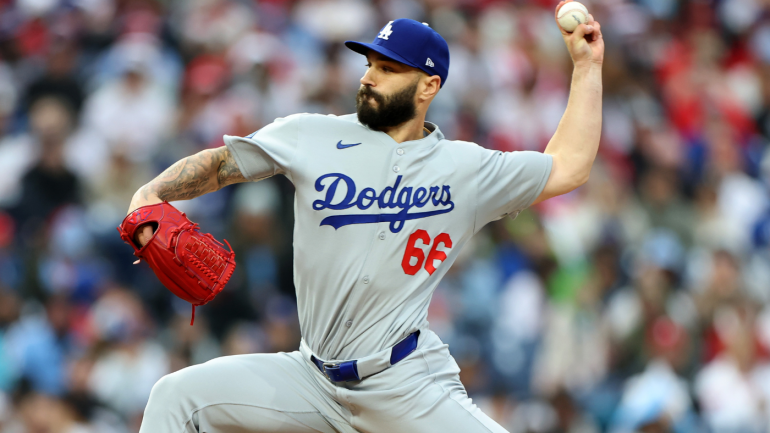
X-factor: Dodgers bullpen
Sometimes there's no need to complicate matters. The Dodgers and the Phillies were two of the best teams during the regular season. Both rosters are packed with All-Star-caliber talents. Each manager has a wealth of postseason experience to draw upon. And so on. There's no reason, other than the postseason's chaotic tendencies, to think this will be anything but a tight series.
That's why the determining factor could well be the performance of the Dodgers bullpen.
You might wonder why my focus is on the Dodgers relief corps when each side's bullpen finished with an identical ERA. Two reasons: foremost, the Dodgers relied far more heavily on their relievers, with Los Angeles' bullpen recording about an inning more per pop than the Phillies'; additionally, the Dodgers' bullpen was far, far more likely to outright blow a game.
For evidence on that second statement, allow me to introduce two metrics housed at FanGraphs: shutdowns and meltdowns. Those self-evident measures both stem from Win Probability Added, or empirical data that tracks how much (or how little) a given player/unit contributed to their team's chances of victory. Take a look at how the two bullpens stacked up:
| Bullpen | IP | ERA | SD | MD | SD/MD ratio |
|---|---|---|---|---|---|
Dodgers | 657.2 | 4.27 | 166 | 100 | 1.66 |
Phillies | 510.2 | 4.27 | 144 | 78 | 1.85 |
Now, here are those same metrics for the five active Dodgers relievers with the highest average leverage indexes:
| Pitcher | IP | ERA | SD | MD | SD/MD ratio |
|---|---|---|---|---|---|
26.2 | 5.40 | 13 | 8 | 1.63 | |
57 | 4.74 | 22 | 14 | 1.57 | |
59.2 | 3.02 | 28 | 13 | 2.15 | |
19 | 2.37 | 5 | 6 | 0.83 | |
68 | 2.51 | 17 | 5 | 3.40 |
If you're a Phillies fan, you're probably happy to see that three of those five Dodgers relievers had even worse shutdown-to-meltdown ratios than the unit as a whole.
If you're a Dodgers fan, well, you can at least hope that the bullpen is in better shape now: in part because the rotation is finally healthy, perhaps releasing some of the workload demands placed upon the bullpen, and in part because the Dodgers have added essentially three new faces to their relief corps: starters Clayton Kershaw, Emmet Sheehan, and Roki Sasaki.
One way or the other -- and there are reasons to think it could go in either direction -- the Dodgers bullpen seems likely to be the biggest story of this series.


Detroit Tigers vs. Seattle Mariners
- X-factor: The running game
This is a classic strength-on-strength situation. The Mariners ranked third in the majors in both stolen base volume and efficiency during the regular season; conversely, the Tigers allowed the fifth fewest heists in the majors as a defensive unit.
Seattle's running attack was led by outfielders Randy Arozarena and Julio Rodríguez, who each cleared the 30-steal threshold. The other active Mariners to top 10 stolen bases are names you wouldn't expect: first baseman Josh Naylor and catcher Cal Raleigh. (What can't Raleigh do?) They combined for 33 successes on 37 attempts. Speed certainly helps when it comes to stealing bases or advancing during play, but don't discount what well-applied opportunism can do, either.


On the Tigers' side of the ledger, their backstops combined for the second most catcher pickoffs in the majors, at six. Of course, pitchers drive the car in this area. It shouldn't surprise anyone, then, that Detroit's pitching staff measured up well when it came to denying the opposition big leads. As a whole, the Tigers' pitchers ranked 11th in lead distance gained overall, and first in lead distance gained on stolen base attempts, suggesting they lock in when they sniff out a thief.
The biggest potential liability for the Tigers is right-hander Casey Mize. He's Detroit's only pitcher to allow more than 10 stolen bases this season, and he regularly allowed the opposition to take a lead of more than five feet from the bag, the worst on the staff. Mize figures to start in the middle of this series. Expect the Mariners to have their running shoes on that day.


New York Yankees vs. Toronto Blue Jays
- X-factor: Zone adjustments
Everyone concedes that baseball is a game of inches. The Yankees and Blue Jays will need to honor that idiom to prevail in a battle between two of the three best framing teams in the majors. (The San Francisco Giants, not present in the postseason bracket, ranked No. 1, per TruMedia.)
The last thing that anyone familiar with online baseball writing from the past decade needs to read nowadays is about catching framing. You know what is, you know how it works. Fair enough. Allow me then to focus here on the inverse: the tweaks that the batters must make.
Let's deal in theory because this isn't a particularly easy thing to quantify. These clubs will, undoubtedly, be engaged in an arms race of sorts to figure out how far they can stretch the strike zone throughout the series. Whenever that's the case, the attention tends to be on the battery. Can this pitcher exploit a generous outside corner; will they continue to work down in the zone if they aren't getting the call; and so on and so forth.
Here, though, I wonder if the onus will be more on the hitters to update their mental strike zone models. Holding on to yesterday's standards will lead to today's failings, and in the playoffs today's failings can quickly result in tomorrow's vacation.
I can't demonstrably prove or predict which players on these teams will and will not make those adjustments. What I can do is stress how important they may be. Five of the 13 games in the seasonal series between the Yankees and Blue Jays were decided by two runs or fewer. When every pitch counts, you better know what is and isn't a strike -- and adjust accordingly.


Chicago Cubs vs. Milwaukee Brewers
- X-factor: Milwaukee's ground balls
The Cubs and the Brewers played 13 times during the regular season as division foes, suggesting they're well-versed in what the other team brings to the table, be it a strength or a weakness. The Brewers, for example, are no doubt aware that the Cubs have one of the most prolific pitching staffs at picking off baserunners. Conversely, the Cubs have to know that the Brewers are as dependent on fastball variants (four-seamer, sinker, cutter) as any club left standing.
While there were a lot of ways to take this X-factor, I decided to focus on what happens when the Brewers are up to bat. Why? Because Milwaukee stands out as the only remaining playoff lineup that ranked in the top half of the majors during the regular season in ground-ball percentage. Former MVP winner Christian Yelich hit nearly 60% ground balls; William Contreras and Blake Perkins checked in near 50%; and Brice Turang, Sal Frelick, and Joey Ortiz weren't too far behind.

In theory, that would seem to make the Cubs a suboptimal opponent. Chicago has one of the best double-play combinations in baseball, in shortstop Dansby Swanson and second baseman Nico Hoerner, and their third-base situation mostly graded as scratch. Yet the Cubs' defensive performance on ground balls wasn't as good as you might expect based on their personnel.
Indeed, the Cubs ranked sixth at converting ground balls with an expected batting average (based on exit velocity and launch angle) below .300. But they weren't as proficient on tough plays. To wit: they were in the bottom half of the league on grounders with an expected average over .300, and they were 24th when the grounder had an expected average over .500. The only remaining playoff team to fare worse on that particular brand of ground ball was the Blue Jays.
Predictably, the Brewers fared very well when they hit ground balls -- if they didn't, they wouldn't have had MLB's best record based on their offensive tendencies. Should those regular season trends hold, this may end up being a favorable matchup for Milwaukee's lineup.