MLB Wild Card Series X-factors: One key that could determine Yankees vs. Red Sox, Dodgers vs. Reds and more
Let's get nerdy with some unseen elements that could affect all four Wild Card Series

Major League Baseball's playoffs are just hours away from kicking off with the four Wild Card Series. These best-of-three matchups, featuring two division winners and four wild card entrees, will determine who moves on to the more-traditional divisional round.
As is always the case at CBS Sports, the start of a new round of the playoffs means that I'm here to break down one X-factor that could swing each series. What is an X-factor, you might ask? To that, dear reader, I would say that it's a term best defined not by what it is but by what it allows: creative license. In this case, I've put that to use by digging in and highlighting some granular matters.
In keeping with tradition, I'm obligated to note that baseball -- and postseason baseball especially -- is a feral beast that is tough to predict. This exercise, then, is for entertainment purposes only.
1. Cincinnati Reds vs. Los Angeles Dodgers
- X-factor: Cincinnati's groundballs
Think of this as the Ron Washington series. Not because Washington had anything to do with these clubs (though he did suit up with the Dodgers in the '70s), but because this should be an exhibition of some top-notch infield work. Indeed, the Reds and the Dodgers were two of the best clubs in the majors at converting ground balls into outs during the regular season. The Reds' .226 average against was tops among playoff squads, with the Dodgers checking in at fifth.
Where things get interesting for me is what happens when the Reds are up to hit. I'm aware that I'm perhaps the only person who will be looking forward to seeing Cincinnati take their swings, and that's because these Reds were one of the teams likeliest to launch the ball into the ground -- and one of the teams likeliest to be rewarded for that with a hit. Five Reds batters who may see serious burn this series (Elly De La Cruz, Miguel Andujar, Ke'Bryan Hayes, Noelvi Marte, and Gavin Lux) had ground-ball percentages over 45 percent this season.
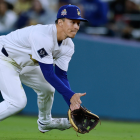
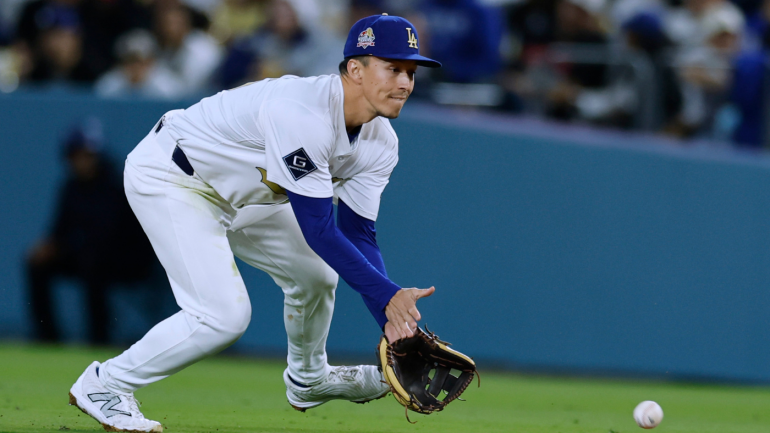
Provided those tendencies hold up, there should be ample fielding opportunities for the Dodgers' middle infielders: shortstop Mookie Betts and whichever of Miguel Rojas, Tommy Edman, and Hyeseong Kim plays second base. Those four are good at what they do.
The best defenders turn line drives into outs. These Dodgers also turn hard-hit grounders into outs. Not because they're ranging far in this or that direction; this isn't about taking three steps and then generating a cloud of infield dust with a diving stop. This is about being well positioned and leveraging your reaction speed, your hands, your body control, and your arm -- with the latter coming into play whenever the aforementioned positioning causes them to play back on the dirt.
TruMedia tracks a statistic called expected batting average, which is generated using exit velocity and launch angle. It's not a perfect measure, but it is handy in this case for showing just how much impact the Dodgers' defense has on their success.
| Team | xBAA on GB | Actual BAA on GB | Net |
|---|---|---|---|
Reds | .240 | .226 | -.014 |
Dodgers | .242 | .230 | -.012 |
The Dodgers surrendered an actual batting average on ground balls this season of .230; their expected average on those ground balls was .242, creating one of the largest gaps between actual and expected average on ground balls of any team. (The Reds, coincidentally, were the only playoff team ahead of them.) What's more is that on ground balls that had an expected average north of .500 -- that is to say, better than a coin flip's chance of going for a hit -- the Dodgers outperformed their expected batting average by 25 points.
Again, a lot of the resulting plays fall short of the standard usually associated with great infield defense: diving steps, leaping throws from the hole, barehanded charges. But what the Dodgers' middle infield lacks in style points, they more than make up for in a more valuable currency: hits and runs prevented.
2. Detroit Tigers vs. Cleveland Guardians
- X-factor: Cleveland's outfield arms
If you like high-scoring affairs, this Guardians-Tigers series may not be for you. These two clubs combined for just over six combined runs per contest in their head-to-head matchups during the regular season. (For context, the MLB average was closer to nine runs per game.) Factor in how the Tigers have Tarik Skubal going and bullpen-happy A.J. Hinch managing, as well as the converging states of the Guardians' pitching staff and lineup, and it reasons runs will be at a premium.
In turn, there ought to be more emphasis on leveraging advancement opportunities during the run of play -- be it scoring from first on a double or showing more aggression on tag-up chances. That dynamic exposes an interesting clash these teams have, with one another and with themselves. Both have a yin and yang thing going on: the Tigers took the extra base at the highest frequency of any team during the regular season, albeit while also making the most outs on the basepaths. The Guardians, meanwhile, led the majors in outfield assists and throwing errors.


The Tigers are not what you would describe as a fast team. They ranked middle of the pack in average sprint speed and their speediest player (Zach McKinstry) was 24th among the 30 team leaders. You don't necessarily have to post impressive home-to-first times to be a running ace, however, and these Tigers exemplify that by having seven players take double-digit extra bases:
| Tigers player | Bases taken | Outs on bases | Bases taken per out |
|---|---|---|---|
Zach McKinstry | 16 | 6 | 2.67 |
16 | 11 | 1.45 | |
14 | 9 | 1.55 | |
Javier Báez | 13 | 1 | 13 |
12 | 2 | 6 | |
11 | 1 | 11 | |
11 | 3 | 3.67 |
You probably didn't expect to see Torkelson and Torres that high on this leaderboard, but their presence speaks to Detroit's philosophy on baserunning and in particular on tagging up. The Tigers ranked fifth in the majors in tag-up attempt rate, with four different players taking at least 10 chances apiece. For as aggressive as the Tigers were, they ranked 22nd in success rate.
I would expect the Tigers to keep their paws on the gas this series -- in large part because that's a part of their team DNA. The Guardians would seem like a decent team to pick on in this respect too, with three-time Gold Glove Award winner Steven Kwan tallying 13 assists and eight throwing errors all by himself. That tells you, above all, that clubs challenge Kwan often, mostly during the run of play. (Comparatively, Kwan's attempted tag-up rate was about half the league-average mark.) Elsewhere in the outfield, most-days center fielder Ángel Martínez and right fielder Nolan Jones were tagged-up on a combined 35 times. They threw out just one attempted advancer.
Jones didn't receive a single start in the final week, suggesting he may not be in Cleveland's postseason plans. All the same, keep the above tendencies in mind whenever the Tigers sky a ball to the outfield with a runner on base.
3. Boston Red Sox vs. New York Yankees
X-factor: Boston's cutters
This is your basic strength-on-strength situation. The Red Sox's staff threw the second-highest frequency of cutters of any team during the regular season, with the cutter being a preferred weapon of Garrett Crochet and Brayan Bello, among others. Conversely, the Yankees posted the highest OPS against cutters of any team. All the names you would expect feasted on that pitch type, ranging from Aaron Judge and Cody Bellinger to Jazz Chisholm Jr., Giancarlo Stanton, Austin Wells, and Ben Rice. Basically any and everyone the Yankees could trot out there this series.


There are two ways for the Red Sox to approach this knowledge. The first is to shy away from their cutter usage in deference to the Yankees. The second is to lean in more and challenge New York's batters to beat them at their best. You can guess which route the Red Sox took during the regular season:
| Split | Cutter usage | OPS against | Whiff% | Barrel% |
|---|---|---|---|---|
vs. Yankees | 15.5% | .806 | 22.1% | 14% |
Overall | 11.7% | .771 | 21.8% | 17.4% |
Yes, the Red Sox threw a higher percentage of cutters against the Yankees than they did overall this season. It didn't necessarily pay off. I think, though, that ascribing the uptick in cutter usage to an intentional design may be an attribution error. The Red Sox as a staff mostly use their cutter in situations where they need a strike. Boston's cutter rate goes from 14% in even counts up to nearly 17% in hitter's counts and all the way down to 6% in pitcher's counts.
Knowing that fact and nothing else, it makes sense that the Red Sox's strike rate against the Yankees was lower than their strike rate against an average foe. In other words, the Red Sox were probably throwing more cutters against New York because they were in worse counts.
The takeaways here, in my estimation, are 1) the Red Sox need to do a better job of avoiding negative counts this series, and 2) when they do need to throw their cutters, they need to execute better. It's that easy, right?
4. Chicago Cubs vs. San Diego Padres
X-factor: Chicago's four-seamers
At a glance, the Cubs' pitching staff appears to be a nightmare matchup for the Padres. Whereas Chicago led the majors in four-seam usage rate, San Diego's lineup ranked in the bottom third in production on four-seamers. The more I looked into this matchup, though, the less predictive power I grant either of those statistics with respect to what's to come in this series.
There are two reasons for that, beginning with the dangers of using full-season numbers. Just because the Cubs threw a lot of four-seamers this year doesn't guarantee they're going to spam a lot here. Strategies change, and so does personnel. To wit, of the eight Cubs pitchers who threw at least 50% four-seamers, six won't appear against the Padres because of either injury or demotion.
The other factor here is that not all fastballs are created equal. The Cubs, be it by design or necessity, tend to roster pitchers who possess supinator motor preferences. That's a fancy way of saying that they come around the ball rather than through it. In practice, that opens up a slew of enticing breaking ball possibilities; it also tends to result in their fastballs featuring less armside run than expected and, at times, outright glove-side cut.


Why does that matter? Because certain swing profiles play better against certain pitch shapes and vice versa. And, more importantly, because the Padres haven't been good against fastballs as a whole, but they've been quite good against fastballs with minimal horizontal break. Indeed, the Padres ranked eighth in OPS against four-seamers that had between four inches of cut and four inches of run. Here's a look at which Cubs pitchers are captured in that range:
| Pitcher | Handedness | Four-seamer usage rate | Horizontal break |
|---|---|---|---|
RHP | 8.1% | 3.8 inches | |
RHP | 42.6% | 1.5 inches | |
LHP | 76.8% | -1.2 inches | |
LHP | 42.1% | -3.5 inches |
None of the Cubs' starting pitchers are included (though injured right-hander Cade Horton would have been if not for his fractured ribs), nor is closer Daniel Palencia, who throws the second-highest frequency of four-seamers on the staff. But the four pitchers ranked above are crucial to Chicago's chances of navigating late-and-close situations, as they rank first, third, fourth, and fifth in average leverage index among active Cubs pitchers.
If this X-factor ends up mattering, it'll likely be felt in the kind of situations that can swing a game -- and, more pressingly, a short series.