This week marks the one-third point of the 2026 MLB season. This is when things get real. Teams typically use the first third of the season to evaluate their roster, the middle third to make any necessary changes, and the final third to ride those changes out. We're entering the "make any necessary changes" part of the 2026 season.
With that in mind, here are three trends to keep an eye on as we head into the dog days of summer.
Jacob Misiorowski's new weapon


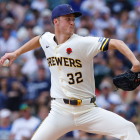
Ho hum, another dominant performance for Brewers ace Jacob Misiorowski on Monday. He took a no-hitter into the sixth inning and held the Cardinals to one run on two singles and a walk in seven innings. He struck out 12, tying a career high. Misiorowski threw 71 strikes among his 96 pitches, or 74%. That's an astronomical number, especially for someone who throws this hard.
Misiorowski's fastball averaged -- averaged -- 101.1 mph and topped out at 103.4 mph Monday. It's not just that Misiorowski throws harder than everyone else. He's 6-foot-7 and his 7.5 feet of extension is tops in baseball. He throws harder than everyone else and releases the ball closer to the plate than everyone else. The case can be made that he is the most overpowering starter ever.
"We're seeing it happen before our eyes, so you start believing it," Brewers pitching coordinator Jim Henderson told MLB.com about Misiorowski's velocity. "Two or three weeks into the season, there was a bullpen between starts when he was touching 99 mph. We were like, 'Jesus.'"
The fastball is obviously otherworldly, but what most stood out Monday was the new slider Misiorowski threw. His primary breaking ball has been a hard slider that was essentially a cutter given its movement. Monday's slider was a true slider with more drop and more, well, slide than the cutter/slider hybrid he usually throws. You can see the difference in the pitch movement plot:
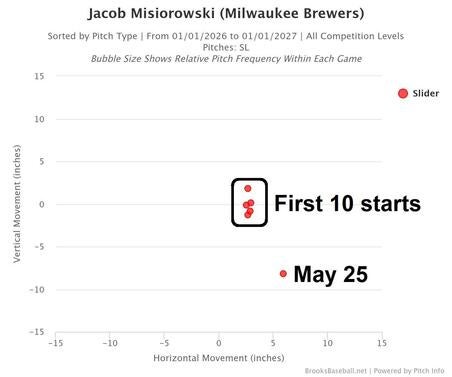
The velocity range on the new slider was the same as the old cutter/slider hybrid, meaning mid-90s, which is preposterous velocity for a breaking ball. The movement is more important than the velocity, though. The old cutter/slider did not move a ton relative to his fastball. Now Misiorowski has his fastball, a curveball that snaps down, and a true slider with movement to his glove side.
Misiorowski is excellent as he is and yet it feels like he still has room to grow. The new slider is one way. I would not be surprised if the Brewers have him work on a sinker at some point, which would give him something to run in on righties and maybe get some quick outs on the ground.
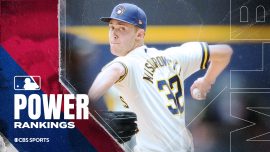
Misiorowski is great and getting better. He may only be scratching the surface of his upside.

Detroit's floundering supporting cast
The first third of the season couldn't be going much worse for the Tigers. They came out of Monday's off day with a 21-33 record, second worst in the AL, though their run differential (minus-25 projects to a 24-30 record) and BaseRuns record (27-27) say they've been better than their actual record. Still, 24-30 or 27-27 is not exactly what was expected of this team.
Tarik Skubal's absence has hurt, for sure, as has a litany of other injuries (Kerry Carpenter, Reese Olson, Gleyber Torres, Justin Verlander, etc.). The biggest problem is the offense, though, not missing Skubal. The Tigers entered play Tuesday averaging only 3.83 runs per game, the fourth fewest in baseball. That number is 2.95 (!) runs per game in May. It's untenable.
Dillon Dingler, Riley Greene, and rookie Kevin McGonigle are a three-man army on offense. They combined for a .276/.370/.440 batting line with 17 homers and 5.5 WAR through 54 team games. The rest of the Tigers were hitting .213/.288/.336 with 29 home runs and minus-2.2 WAR. Three players who were important platoon bats in 2025 have been poor in 2026:
| 2025 OPS in platoon | 2026 OPS in platoon | |
|---|---|---|
.970 vs. LHP | .622 vs. LHP | |
.785 vs. RHP | .674 vs. RHP | |
.746 vs. RHP | .506 vs. RHP |
Declines of over 100 OPS points across the board and much more than that with Jones and McKinstry. Those three combined for 5.9 WAR last year (3.2 from McKinstry). They're at minus-1.1 WAR one-third of the way into this season. On any given night, the Tigers have three great hitters in the lineup (Dingler, Greene, McGonigle) and a lot of zeroes. It's hard to win that way.
As bad as they've been, the Tigers went into Tuesday's game only five games out of a wild card spot. Five games with eight teams ahead of them, which ups the difficulty, but five games nonetheless. They have to start stacking wins soon to avoid an uncomfortable trade-deadline decision with Skubal. For that to happen, the offense's supporting cast has to pick up the slack.
Offense at the one-third point of the season
Memorial Day is the symbolic one-third point of the season and, this year, the mathematical one-third point of the season too. Going into Tuesday, 806 of the season's 2,430 games had been played, or 33.2%. That's as close to the mathematical one-third point as you can get. Here is our Memorial Day check-in on the league standings and the awards races.
The one-third point is a good time to check in on the league's offensive environment. Here is what the league is doing this year compared to the one-third point last year (May 26, 2025, to be precise):
| 2025 one-third point | 2025 full season | 2026 one-third point | |
|---|---|---|---|
Runs per game | 8.62 | 8.89 | 8.73 |
Home runs per game | 2.14 | 2.33 | 2.09 |
Stolen bases per game | 1.55 | 1.42 | 1.39 |
Batting average | .244 | .245 | .239 |
On-base percentage | .316 | .315 | .318 |
Slugging percentage | .394 | .404 | .387 |
OPS | .710 | .719 | .705 |
Strikeout rate | 21.9% | 22.2% | 22.1% |
Walk rate | 8.7% | 8.4% | 9.3% |
Just to be clear, those "per game" stats are for the two teams combined, not per team. No team is averaging over two homers per game this year (or last year), I promise. Anyway, compared to the one-third point last year, runs per game are up even though home runs, steals, and batting average are down. It can't all be explained by a few extra walks, can it?
No, it can't. We can thank the extra-innings automatic runner for much of the offensive inflation this year. At the one-third point last season, the average was 8.39 runs per game in the first nine innings. This year it's 8.44. To put it another way, 3.3% of this year's runs have been scored in 1.3% of the innings (i.e. extra innings). The automatic runner skews offense league-wide.
The league's 9.3% walk rate is a direct result of the ABS challenge system. Every time ABS was introduced to a new league in the minors, the walk rate shot up. Walks are trending down, though. The league had a 9.6% walk rate in April. It's 8.9% in May, which is a more "normal" number in line with previous years. Chalk that up to players getting familiar with ABS.
To me, the biggest concern is that batting average. We've still got a few days to go this month, but the league hasn't hit under .240 through May since 2021 (.236), which was an unusual season with COVID restrictions still in place early on. The last time the league hit under .240 through May before that was 1968 (.229), the year before the mound was lowered.
MLB eliminated the infield shift a few years ago, hoping it would boost the league's batting average. But it hasn't helped at all. It's easy to blame the hitters here because they're all focused on launch angle and hitting homers, blah blah blah, but it starts with the guys on the mound. Pitching is so good now. They're all nasty and their usage is optimized to the nth degree. It's really, really hard to hit.
History says offense will rise as the weather warms up, and I'm sure that will be the case this year. Aesthetics matter, though, and an entire league hitting under .240 for the first 33% of the season is an eyesore. I don't know how you fix this -- I'd start with limiting the number of pitchers allowed on a roster -- but it feels like we're at the point where intervention is needed.