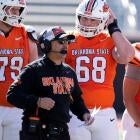
New Oklahoma State coach Eric Morris inherited a program that went 1-11 last season and hasn't won a conference game in more than two years. So naturally, he tore much of it down and rebuilt it. The Cowboys rank 134th nationally with just 10% of their snaps returning from last season's roster. And yet, entering 2026, Oklahoma State sits third in the country in total career FBS snaps and fourth in games played.
A decade ago, building an experienced roster meant recruiting well, developing players, and waiting for them to mature. Now, programs can rebuild experience almost overnight by adding proven college veterans from across the country.
That shift matters because experience still shows up in winning rosters. It's not a perfect measure of success, but teams that play deep into January are increasingly built around players who have already handled college football's physical demands, weekly grind and high-pressure moments. In theory, that kind of roster should be better than one with lesser experience.
Using data from TruMedia, CBS Sports analyzed every FBS roster entering the season, ranking teams by total career experience while also mapping where that experience is concentrated across the roster. The dataset includes offensive and defensive snaps, games played, and starts accumulated throughout players' FBS careers. Special teams contributors such as kickers, punters, and long snappers are not included.
Because the data is limited to FBS competition, newcomers North Dakota State and Sacramento State appear at the bottom of the experience rankings.
Positional breakdowns are based on Pro Football Focus classifications to provide a consistent framework across all 138 FBS programs. As a result, some players may be grouped differently than they are listed on their school's official roster. Experience totals are attributed to a player's primary position designation rather than where they lined up on every snap.
In the coming weeks, we'll build on that foundation by examining returning offensive and defensive production in greater detail, identifying the teams that not only bring back experience but also proven playmaking and efficiency across the field.
But first, let's see which teams enter 2026 with the most experienced rosters in college football.
Overall experience
| Team | Total Snaps | Off. Snaps (Rank) | Def. Snaps (Rank) | Games (Rank) | Starts (Rank) |
|---|---|---|---|---|---|
1. Virginia | 39,158 | 20,870 (1) | 18,288 (2) | 1,314 (1) | 571 (1) |
2. Texas Tech | 35,838 | 17,072 (6) | 18,766 (1) | 1,115 (4) | 483 (3) |
3. Oklahoma State | 34,621 | 16,965 (7) | 17,656 (3) | 1,111 (5) | 458 (5) |
4. Ole Miss | 32,794 | 15,982 (11) | 16,812 (5) | 1,072 (6) | 455 (6) |
5. Houston | 32,439 | 18,538 (2) | 13,901 (17) | 986 (16) | 489 (2) |
6. UCLA | 32,359 | 18,296 (4) | 14,063 (15) | 1,121 (3) | 419 (8) |
7. Texas A&M | 31,368 | 14,653 (16) | 16,715 (6) | 1,062 (7) | 422 (7) |
8. Indiana | 30,540 | 15,653 (13) | 14,887 (11) | 921 (26) | 462 (4) |
9. Auburn | 29,363 | 16,664 (8) | 12,699 (30) | 1,003 (13) | 401 (9) |
10. Vanderbilt | 29,203 | 12,371 (34) | 16,832 (4) | 1,160 (2) | 397 (12) |
11. SMU | 29,018 | 14,908 (14) | 14,110 (14) | 1,028 (10) | 336 (37) |
12. Virginia Tech | 28,439 | 14,394 (20) | 14,045 (16) | 1,013 (11) | 359 (24) |
13. LSU | 27,993 | 14,752 (15) | 13,241 (24) | 950 (24) | 390 (13) |
14. Nebraska | 27,982 | 16,499 (9) | 11,483 (47) | 1,042 (9) | 399 (11) |
15. Baylor | 27,793 | 14,523 (18) | 13,270 (23) | 1,004 (12) | 353 (27) |
16. South Carolina | 27,742 | 18,381 (3) | 9,361 (72) | 956 (22) | 385 (16) |
17. Penn State | 27,562 | 13,263 (28) | 14,299 (13) | 973 (19) | 400 (10) |
18. California | 27,293 | 16,406 (10) | 10,887 (55) | 968 (20) | 326 (39) |
19. Arizona State | 27,202 | 12,577 (32) | 14,625 (12) | 927 (25) | 374 (18) |
20. Texas | 27,120 | 13,308 (27) | 13,812 (19) | 986 (16) | 366 (20) |
21. Oklahoma | 27,089 | 17,353 (5) | 9,736 (67) | 911 (27) | 368 (19) |
22. UCF | 26,945 | 11,514 (42) | 15,431 (8) | 892 (33) | 378 (17) |
23. Tennessee | 26,740 | 11,242 (47) | 15,498 (7) | 906 (28) | 360 (23) |
24. Colorado | 26,384 | 13,514 (25) | 12,870 (27) | 871 (41) | 389 (14) |
25. Kansas | 26,341 | 11,412 (45) | 14,929 (10) | 892 (33) | 366 (20) |
26. Florida | 26,059 | 12,931 (30) | 13,128 (25) | 954 (23) | 339 (35) |
27. Maryland | 25,951 | 13,667 (24) | 12,284 (35) | 883 (37) | 343 (32) |
28. Louisville | 25,871 | 14,101 (21) | 11,770 (42) | 869 (43) | 387 (15) |
29. Miami | 25,739 | 10,767 (53) | 14,972 (9) | 1,001 (14) | 348 (30) |
30. BYU | 25,407 | 12,006 (40) | 13,401 (22) | 982 (18) | 326 (39) |
31. Ohio State | 25,251 | 14,067 (22) | 11,184 (52) | 968 (20) | 352 (28) |
32. Washington | 25,219 | 12,156 (37) | 13,063 (26) | 757 (67) | 358 (25) |
33. South Florida | 25,145 | 13,897 (23) | 11,248 (51) | 1,053 (8) | 283 (53) |
34. Arizona | 25,116 | 11,466 (43) | 13,650 (20) | 813 (53) | 357 (26) |
35. Florida State | 25,108 | 13,348 (26) | 11,760 (44) | 897 (32) | 362 (22) |
36. Oregon | 24,938 | 12,298 (36) | 12,640 (32) | 889 (35) | 342 (33) |
37. West Virginia | 24,620 | 14,584 (17) | 10,036 (61) | 804 (56) | 342 (33) |
38. Arkansas | 24,598 | 13,074 (29) | 11,524 (46) | 882 (38) | 317 (41) |
39. Illinois | 24,417 | 14,409 (19) | 10,008 (62) | 833 (50) | 350 (29) |
40. Tulsa | 24,152 | 11,406 (46) | 12,746 (28) | 880 (39) | 309 (43) |
41. Pittsburgh | 23,765 | 12,371 (34) | 11,394 (50) | 774 (65) | 331 (38) |
42. Georgia | 23,745 | 11,010 (50) | 12,735 (29) | 991 (15) | 306 (45) |
43. Michigan State | 23,552 | 12,084 (39) | 11,468 (48) | 824 (51) | 339 (35) |
44. Minnesota | 23,266 | 11,431 (44) | 11,835 (40) | 793 (61) | 345 (31) |
45. Missouri | 23,027 | 15,832 (12) | 7,195 (93) | 879 (40) | 316 (42) |
46. Notre Dame | 22,813 | 8,933 (75) | 13,880 (18) | 906 (28) | 307 (44) |
47. Northwestern | 22,383 | 10,693 (55) | 11,690 (45) | 887 (36) | 297 (47) |
22,144 | 10,272 (60) | 11,872 (39) | 841 (48) | 253 (67) | |
49. TCU | 21,999 | 9,634 (67) | 12,365 (33) | 786 (63) | 290 (51) |
50. Kentucky | 21,880 | 11,938 (41) | 9,942 (63) | 810 (55) | 303 (46) |
51. Memphis | 21,767 | 10,696 (54) | 11,071 (53) | 752 (70) | 277 (57) |
52. Liberty | 21,497 | 12,930 (31) | 8,567 (79) | 867 (44) | 279 (54) |
53. Stanford | 21,438 | 9,435 (69) | 12,003 (37) | 749 (71) | 286 (52) |
54. Purdue | 21,240 | 9,800 (64) | 11,440 (49) | 849 (46) | 262 (61) |
55. Clemson | 20,891 | 10,002 (61) | 10,889 (54) | 900 (30) | 228 (76) |
56. Miami (Ohio) | 20,828 | 8,496 (77) | 12,332 (34) | 871 (41) | 258 (62) |
57. Georgia Tech | 20,719 | 8,060 (82) | 12,659 (31) | 779 (64) | 267 (59) |
58. Tulane | 20,687 | 8,924 (76) | 11,763 (43) | 900 (30) | 220 (80) |
58. USC | 20,687 | 10,341 (58) | 10,346 (58) | 709 (78) | 291 (50) |
60. UNLV | 20,555 | 12,557 (33) | 7,998 (86) | 850 (45) | 245 (74) |
61. Wake Forest | 20,531 | 7,037 (96) | 13,494 (21) | 739 (73) | 292 (48) |
62. Cincinnati | 20,490 | 8,399 (79) | 12,091 (36) | 734 (74) | 292 (48) |
63. Kansas State | 20,284 | 11,100 (48) | 9,184 (77) | 795 (58) | 257 (63) |
64. Florida Atlantic | 20,278 | 9,413 (70) | 10,865 (56) | 795 (58) | 254 (64) |
65. Rutgers | 20,116 | 10,918 (52) | 9,198 (76) | 761 (66) | 279 (54) |
66. San Diego State | 20,115 | 10,424 (57) | 9,691 (68) | 797 (57) | 264 (60) |
67. Utah | 19,953 | 9,843 (63) | 10,110 (59) | 790 (62) | 254 (64) |
68. Boise State | 19,854 | 10,649 (56) | 9,205 (75) | 795 (58) | 254 (64) |
69. Michigan | 19,817 | 8,035 (83) | 11,782 (41) | 755 (69) | 278 (56) |
70. Georgia Southern | 19,810 | 9,181 (72) | 10,629 (57) | 814 (52) | 251 (68) |
71. Duke | 19,765 | 12,155 (38) | 7,610 (88) | 744 (72) | 248 (70) |
72. Alabama | 19,502 | 7,543 (89) | 11,959 (38) | 840 (49) | 275 (58) |
73. NC State | 19,428 | 11,066 (49) | 8,362 (80) | 690 (80) | 248 (70) |
74. Wisconsin | 18,958 | 9,664 (66) | 9,294 (73) | 813 (53) | 247 (73) |
75. Arkansas State | 18,583 | 9,700 (65) | 8,883 (78) | 669 (84) | 239 (75) |
76. Syracuse | 18,339 | 9,066 (73) | 9,273 (74) | 757 (67) | 248 (70) |
77. UTSA | 18,015 | 10,959 (51) | 7,056 (95) | 844 (47) | 184 (89) |
78. Iowa State | 17,513 | 7,723 (88) | 9,790 (65) | 723 (76) | 217 (82) |
79. Kennesaw State | 17,153 | 7,044 (95) | 10,109 (60) | 581 (98) | 210 (83) |
80. New Mexico | 17,085 | 7,506 (90) | 9,579 (70) | 544 (103) | 250 (69) |
81. Boston College | 16,876 | 7,087 (94) | 9,789 (66) | 678 (83) | 210 (83) |
82. Utah State | 16,836 | 6,902 (100) | 9,934 (64) | 604 (91) | 219 (81) |
83. North Texas | 16,637 | 8,454 (78) | 8,183 (81) | 725 (75) | 204 (85) |
84. Marshall | 16,500 | 9,934 (62) | 6,566 (97) | 600 (93) | 221 (79) |
85. Texas State | 15,980 | 7,861 (87) | 8,119 (82) | 680 (82) | 181 (94) |
86. New Mexico State | 15,853 | 6,236 (105) | 9,617 (69) | 606 (90) | 225 (77) |
87. Fresno State | 15,305 | 7,250 (92) | 8,055 (85) | 684 (81) | 223 (78) |
88. FIU | 14,988 | 5,582 (113) | 9,406 (71) | 618 (88) | 158 (100) |
89. Western Kentucky | 14,682 | 9,250 (71) | 5,432 (109) | 607 (89) | 183 (91) |
90. Hawaii | 14,472 | 7,909 (86) | 6,563 (98) | 706 (79) | 179 (95) |
91. Army | 14,388 | 10,324 (59) | 4,064 (129) | 594 (96) | 202 (86) |
92. Louisiana | 14,299 | 8,983 (74) | 5,316 (111) | 595 (95) | 169 (97) |
93. Temple | 14,267 | 9,522 (68) | 4,745 (122) | 584 (97) | 182 (93) |
94. East Carolina | 14,112 | 7,932 (84) | 6,180 (101) | 713 (77) | 124 (120) |
95. Delaware | 13,995 | 8,399 (79) | 5,596 (105) | 465 (119) | 187 (88) |
96. Washington State | 13,316 | 6,960 (97) | 6,356 (100) | 639 (85) | 143 (111) |
97. Eastern Michigan | 13,239 | 6,012 (107) | 7,227 (92) | 500 (113) | 188 (87) |
98. North Carolina | 13,060 | 5,655 (112) | 7,405 (89) | 599 (94) | 183 (91) |
99. Troy | 13,018 | 6,927 (98) | 6,091 (103) | 560 (100) | 138 (114) |
100. UConn | 12,940 | 5,002 (122) | 7,938 (87) | 620 (87) | 142 (112) |
101. Western Michigan | 12,934 | 7,914 (85) | 5,020 (115) | 577 (99) | 174 (96) |
102. Colorado State | 12,898 | 4,839 (124) | 8,059 (84) | 626 (86) | 140 (113) |
103. Oregon State | 12,783 | 6,615 (102) | 6,168 (102) | 519 (109) | 184 (89) |
104. Rice | 12,522 | 5,245 (117) | 7,277 (91) | 604 (91) | 151 (104) |
105. Navy | 12,461 | 6,008 (108) | 6,453 (99) | 521 (107) | 166 (98) |
106. UAB | 12,457 | 7,249 (93) | 5,208 (113) | 552 (101) | 155 (101) |
107. Jacksonville State | 12,450 | 5,061 (120) | 7,389 (90) | 548 (102) | 155 (101) |
108. Coastal Carolina | 12,392 | 5,300 (116) | 7,092 (94) | 527 (105) | 149 (106) |
109. Louisiana Tech | 12,064 | 7,417 (91) | 4,647 (124) | 472 (118) | 149 (106) |
110. Iowa | 11,779 | 6,784 (101) | 4,995 (116) | 527 (105) | 148 (108) |
111. Nevada | 11,739 | 6,169 (106) | 5,570 (106) | 515 (110) | 151 (104) |
112. Akron | 11,588 | 5,953 (109) | 5,635 (104) | 495 (115) | 145 (109) |
113. Air Force | 11,563 | 4,677 (127) | 6,886 (96) | 478 (117) | 155 (101) |
114. Central Michigan | 11,387 | 8,082 (81) | 3,305 (133) | 507 (111) | 166 (98) |
115. Missouri State | 11,319 | 6,244 (104) | 5,075 (114) | 531 (104) | 132 (115) |
116. Louisiana Monroe | 10,682 | 5,711 (111) | 4,971 (117) | 443 (125) | 128 (118) |
117. Charlotte | 10,423 | 5,003 (121) | 5,420 (110) | 502 (112) | 126 (119) |
118. Kent State | 10,335 | 5,426 (115) | 4,909 (119) | 444 (124) | 130 (117) |
119. Toledo | 10,274 | 6,913 (99) | 3,361 (132) | 520 (108) | 104 (126) |
120. Old Dominion | 10,226 | 2,116 (136) | 8,110 (83) | 463 (120) | 114 (122) |
121. Ball State | 10,149 | 4,859 (123) | 5,290 (112) | 498 (114) | 144 (110) |
122. UMass | 10,127 | 5,243 (118) | 4,884 (120) | 460 (121) | 131 (116) |
123. App State | 10,018 | 5,074 (119) | 4,944 (118) | 439 (126) | 106 (125) |
124. Wyoming | 9,485 | 4,697 (125) | 4,788 (121) | 455 (122) | 113 (124) |
125. Georgia State | 9,333 | 6,448 (103) | 2,885 (134) | 445 (123) | 116 (121) |
126. Sam Houston | 9,301 | 4,563 (129) | 4,738 (123) | 394 (133) | 114 (122) |
127. James Madison | 9,207 | 4,678 (126) | 4,529 (125) | 487 (116) | 101 (128) |
128. South Alabama | 9,086 | 5,555 (114) | 3,531 (131) | 400 (131) | 96 (131) |
129. Middle Tennessee | 8,795 | 4,469 (130) | 4,326 (126) | 406 (129) | 101 (128) |
130. Southern Miss | 8,410 | 5,930 (110) | 2,480 (135) | 410 (128) | 77 (133) |
131. Buffalo | 8,263 | 4,031 (131) | 4,232 (128) | 357 (134) | 91 (132) |
132. Ohio | 8,149 | 2,694 (134) | 5,455 (108) | 404 (130) | 101 (128) |
133. UTEP | 7,729 | 2,258 (135) | 5,471 (107) | 349 (135) | 103 (127) |
134. San Jose State | 7,243 | 3,596 (132) | 3,647 (130) | 437 (127) | 71 (136) |
135. Bowling Green | 6,972 | 2,702 (133) | 4,270 (127) | 399 (132) | 75 (134) |
136. Northern Illinois | 5,796 | 4,658 (128) | 1,138 (136) | 260 (136) | 74 (135) |
137. Sacramento State | 1,937 | 1,396 (137) | 541 (137) | 135 (137) | 9 (137) |
138. North Dakota State | 90 | 7 (138) | 83 (138) | 11 (138) | 0 (138) |
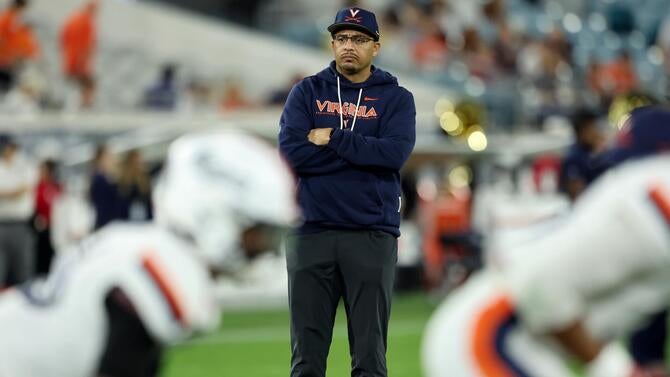
Virginia probably isn't a team many would guess to lead the country in career snaps entering the 2026 season. The Cavaliers were hit hard by attrition after reaching the ACC Championship Game, but coach Tony Elliott responded by importing proven experience. Seventeen of Virginia's 30 incoming transfers have played at least 400 career FBS snaps, and those newcomers now make up more than half of the roster's 33 players who have reached that mark.
The Cavaliers also lead the country in combined games played and starts. That veteran depth of experience is reflected at the top of the roster as well. Offensive lineman Noah Josey (2,824 snaps) ranks as the most experienced player in college football, and four of the 17 active players with the highest combined snap totals in the FBS reside in Charlottesville.
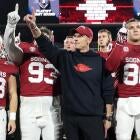
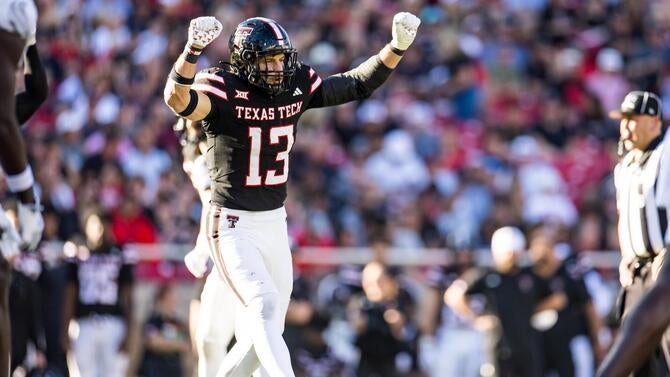
Texas Tech follows closely behind in the overall experience, though its placement comes with a notable caveat. Quarterback Brendan Sorsby is not included in these totals amid uncertainty surrounding his 2026 availability following a gambling investigation. His absence alone drops the Red Raiders from second to seventh in career offensive snaps. Even so, Texas Tech's profile remains strong, particularly on the defensive side of the ball. The Red Raiders again project to lean on a veteran unit that leads all FBS teams in defensive snaps. No roster in the country features more players with at least 1,000 career defensive snaps than Texas Tech's eight:
- LB Ben Roberts (2,137)
- DL A.J. Holmes Jr. (1,758)
- CB Brice Pollock (1,701)
- EDGE Trey White (1,560)
- SAF Brenden Jordan (1,442)
- LB Austin Romaine (1,394)
- CB Amier Boyd (1,326)
- EDGE Adam Trick (1,195)
Those eight players alone account for 12,513 career defensive snaps, more defensive experience than 106 FBS teams, including 37 Power Four programs, return on their entire roster.
Three teams from the top 25 of the CBS Sports 138 land in the bottom half of the FBS in overall experience: No. 11 Alabama (72nd in total snaps), No. 16 Michigan (69th) and No. 23 Iowa (110th). The Hawkeyes are the biggest outlier of the bunch. They have the fewest total snaps (11,779) and defensive snaps (4,995) of any Power Four program, while their 6,784 offensive snaps rank second fewest.
Another way to look at roster experience is by distribution between offense and defense, and in some cases, the split is significant. Alabama stands out defensively, with 61% of its total career snaps coming from the defensive side of the ball. That figure is the second-highest defensive share among Power Four programs and reflects a team that is leaning on younger, less experienced players offensively. The Crimson Tide could start as many as seven underclassmen on offense alone this fall, including quarterback if redshirt freshman and former five-star Keelon Russell wins the job.
Alabama trails only Wake Forest (66%) in that category. Georgia Tech (61%), Notre Dame (61%) and Michigan (60%) round out the top five among Power Four teams, each entering 2026 with a clear majority of their collective experience residing on the defensive side of the ball.
On the other side, a trio of SEC programs -- Missouri (69%), South Carolina (66%) and Oklahoma (64%) -- possess some of the most offense-heavy experience profiles in the country. Combined, the three programs have just four players with at least 1,000 career defensive snaps, well below the Power Four average of 3.3 per team entering the 2026 season.
While the overall rankings tell us which teams have accumulated the most experience, the position-group breakdown below shows where that experience lies.
Offense experience
Teams ranked in order of total offensive snaps
| Team | QB Snaps | RB Snaps | WR Snaps | TE Snaps | OL Snaps |
|---|---|---|---|---|---|
1. Virginia | 1,763 (27) | 2,065 (5) | 4,349 (14) | 1,223 (44) | 11,456 (1) |
2. Houston | 1,648 (31) | 1,742 (13) | 5,429 (3) | 2,326 (10) | 7,383 (12) |
3. South Carolina | 1,630 (33) | 842 (76) | 3,980 (20) | 1,910 (15) | 10,010 (2) |
4. UCLA | 1,596 (34) | 1,695 (15) | 4,572 (10) | 1,647 (20) | 8,748 (3) |
5. Oklahoma | 1,638 (32) | 1,437 (31) | 4,570 (11) | 3,031 (2) | 6,651 (21) |
6. Texas Tech | 1,275 (46) | 1,549 (21) | 5,171 (5) | 2,232 (12) | 6,827 (17) |
7. Oklahoma State | 1,246 (49) | 1,321 (36) | 5,050 (6) | 835 (73) | 8,506 (4) |
8. Auburn | 2,317 (10) | 2,432 (1) | 2,937 (41) | 2,156 (13) | 6,808 (18) |
9. Nebraska | 2,461 (8) | 278 (130) | 3,890 (23) | 1,354 (33) | 8,343 (5) |
10. California | 1,331 (45) | 925 (68) | 4,627 (9) | 1,478 (26) | 8,038 (9) |
11. Ole Miss | 1,240 (50) | 1,188 (46) | 5,294 (4) | 1,519 (24) | 6,722 (19) |
12. Missouri | 997 (68) | 1,497 (26) | 3,121 (37) | 2,470 (8) | 7,738 (11) |
13. Indiana | 3,004 (3) | 1,437 (31) | 3,369 (35) | 10 (135) | 7,828 (10) |
14. SMU | 1,999 (19) | 1,469 (29) | 2,890 (43) | 2,766 (6) | 5,773 (35) |
15. LSU | 1,427 (42) | 1,368 (35) | 4,640 (8) | 964 (62) | 6,346 (27) |
16. Texas A&M | 1,519 (37) | 875 (75) | 3,746 (26) | 2,937 (3) | 5,562 (38) |
17. West Virginia | 1,061 (64) | 1,285 (38) | 3,011 (40) | 1,150 (50) | 8,068 (8) |
18. Baylor | 1,195 (55) | 1,054 (57) | 4,211 (16) | 986 (60) | 7,054 (15) |
19. Illinois | 1,792 (24) | 883 (72) | 5,589 (2) | 1,677 (19) | 4,455 (58) |
20. Virginia Tech | 474 (94) | 1,284 (39) | 3,515 (31) | 2,871 (5) | 6,216 (28) |
21. Louisville | 133 (121) | 1,164 (48) | 2,137 (73) | 2,346 (9) | 8,315 (6) |
22. Ohio State | 931 (73) | 741 (87) | 3,979 (21) | 2,244 (11) | 6,096 (29) |
23. South Florida | 1,102 (61) | 266 (131) | 5,846 (1) | 1,333 (36) | 5,342 (40) |
24. Maryland | 1,199 (54) | 959 (65) | 2,365 (61) | 2,736 (7) | 6,408 (26) |
25. Colorado | 676 (86) | 714 (90) | 4,500 (13) | 505 (98) | 7,111 (14) |
26. Florida State | 1,479 (40) | 1,784 (12) | 1,955 (84) | 1,441 (27) | 6,678 (20) |
27. Texas | 1,736 (28) | 1,691 (16) | 4,166 (17) | 875 (67) | 4,835 (47) |
28. Penn State | 2,538 (6) | 1,417 (34) | 2,231 (69) | 3,129 (1) | 3,734 (71) |
29. Arkansas | 152 (120) | 1,028 (58) | 3,600 (28) | 1,100 (54) | 7,189 (13) |
30. Florida | 386 (101) | 2,018 (6) | 4,508 (12) | 935 (63) | 5,075 (43) |
31. Liberty | 2,524 (7) | 2,396 (2) | 2,266 (66) | 1,288 (38) | 4,444 (59) |
32. Arizona State | 2,919 (4) | 534 (109) | 4,876 (7) | 1,131 (52) | 3,097 (85) |
33. UNLV | 1,553 (35) | 1,878 (8) | 2,808 (47) | 1,530 (22) | 4,787 (48) |
34. Vanderbilt | 90 (85) | 1,983 (7) | 2,601 (54) | 1,529 (23) | 6,068 (30) |
35. Pittsburgh | 699 (85) | 732 (88) | 1,464 (108) | 1,169 (48) | 8,292 (7) |
36. Oregon | 2,734 (5) | 965 (64) | 3,525 (30) | 846 (71) | 4,169 (65) |
37. Washington | 1,419 (43) | 927 (67) | 2,037 (78) | 1,267 (41) | 6,505 (23) |
38. Duke | 1,224 (52) | 1,136 (49) | 915 (123) | 2,926 (4) | 5,940 (33) |
39. Michigan State | 2,238 (12) | 2,305 (4) | 1,980 (82) | 438 (101) | 5,111 (42) |
40. BYU | 1,428 (41) | 1,671 (17) | 2,742 (50) | 1,134 (51) | 5,003 (44) |
41. Kentucky | 185 (117) | 1,509 (24) | 2,084 (76) | 1,214 (45) | 6,940 (16) |
42. UCF | 3,582 (1) | 335 (126) | 1,965 (83) | 1,438 (28) | 4,190 (64) |
43. Arizona | 2,252 (11) | 1,027 (59) | 3,564 (29) | 395 (105) | 4,224 (62) |
44. Minnesota | 980 (70) | 1,536 (23) | 3,731 (27) | 604 (91) | 4,579 (54) |
45. Kansas | 1,014 (66) | 1,469 (29) | 2,793 (48) | 1,569 (21) | 4,563 (55) |
46. Tulsa | 1,169 (58) | 1,715 (14) | 3,843 (25) | 187 (122) | 4,475 (57) |
47. Tennessee | 231 (111) | 1,110 (52) | 2,036 (79) | 1,333 (36) | 6,411 (25) |
48. Kansas State | 1,779 (25) | 1,113 (51) | 3,174 (36) | 1,783 (16) | 3,250 (81) |
49. NC State | 2,007 (18) | 746 (86) | 3,420 (33) | 58 (130) | 4,783 (49) |
50. Georgia | 1,189 (57) | 1,585 (18) | 2,108 (74) | 1,407 (30) | 4,715 (50) |
51. UTSA | 2,127 (15) | 1,025 (60) | 2,152 (72) | 325 (115) | 5,215 (41) |
52. Rutgers | 544 (92) | 1,499 (25) | 1,912 (85) | 913 (65) | 5,595 (31) |
53. Miami | 1,678 (30) | 1,813 (11) | 4,013 (19) | 840 (72) | 2,418 (103) |
54. Memphis | 14 (135) | 1,013 (61) | 2,448 (59) | 770 (81) | 6,447 (24) |
55. Northwestern | 2,208 (14) | 2,337 (3) | 2,659 (52) | 1,275 (40) | 2,202 (111) |
56. Boise State | 2,225 (13) | 1,241 (43) | 1,103 (116) | 1,379 (32) | 4,695 (52) |
57. San Diego State | 1,095 (62) | 1,478 (28) | 3,884 (24) | 670 (89) | 3,282 (80) |
58. USC | 2,033 (16) | 630 (98) | 1,341 (109) | 851 (69) | 5,482 (39) |
59. Army | 668 (88) | 1,873 (9) | 936 (122) | 1,108 (53) | 5,735 (36) |
60. Mississippi State | 1,518 (38) | 804 (79) | 3,092 (39) | 778 (78) | 3,874 (68) |
61. Clemson | 274 (105) | 727 (89) | 3,922 (22) | 1,086 (56) | 3,855 (69) |
62. Marshall | 1,917 (20) | 215 (13) | 2,824 (46) | 1,510 (25) | 3,448 (75) |
63. Utah | 2,012 (17) | 1,281 (40) | 4,263 (15) | 545 (95) | 1,656 (123) |
64. Purdue | 926 (74) | 613 (100) | 3,476 (32) | 567 (94) | 4,216 (63) |
65. Arkansas State | 523 (94) | 1,564 (20) | 2,282 (65) | 779 (77) | 4,550 (56) |
66. Wisconsin | 2,421 (9) | 1,543 (22) | 2,551 (55) | 591 (92) | 2,549 (95) |
67. TCU | 0 (136) | 605 (103) | 2,016 (81) | 381 (107) | 6,528 (22) |
68. Temple | 47 (132) | 912 (69) | 1,316 (110) | 1,335 (35) | 5,898 (34) |
69. Stanford | 795 (81) | 1,497 (26) | 757 (127) | 435 (102) | 5,949 (32) |
70. Florida Atlantic | 1,867 (22) | 354 (123) | 4,020 (18) | 1,051 (59) | 2,113 (113) |
71. Western Kentucky | 796 (80) | 666 (94) | 2,782 (49) | 380 (108) | 4,610 (53) |
72. Georgia Southern | 1,868 (21) | 777 (81) | 2,059 (77) | 1,276 (39) | 3,201 (83) |
73. Syracuse | 1,764 (26) | 333 (127) | 2,309 (64) | 1,351 (34) | 3,227 (82) |
74. Louisiana | 851 (76) | 94 (134) | 1,594 (101) | 1,383 (31) | 5,000 (45) |
75. Notre Dame | 665 (89) | 305 (129) | 2,543 (56) | 1,072 (57) | 4,329 (61) |
76. Tulane | 1,819 (23) | 1,575 (19) | 1,611 (99) | 697 (87) | 3,099 (84) |
77. Miami (Ohio) | 213 (113) | 601 (104) | 1,661 (94) | 357 (109) | 5,655 (37) |
78. North Texas | 1,124 (60) | 817 (78) | 2,262 (67) | 1,230 (43) | 3,011 (86) |
79. Cincinnati | 1,722 (29) | 1,420 (33) | 906 (124) | 331 (114) | 4,017 (66) |
80. Delaware | 936 (72) | 1,307 (37) | 2,690 (51) | 919 (64) | 2,537 (97) |
81. Central Michigan | 452 (96) | 1,110 (52) | 1,759 (90) | 345 (110) | 4,410 (60) |
82. Georgia Tech | 120 (122) | 1,276 (41) | 554 (132) | 1,088 (55) | 4,978 (46) |
83. Michigan | 802 (79) | 582 (107) | 2,085 (75) | 675 (88) | 3,624 (72) |
84. East Carolina | 1,070 (63) | 881 (73) | 2,851 (45) | 637 (90) | 2,475 (101) |
85. Western Michigan | 874 (75) | 1,872 (10) | 1,844 (87) | 395 (105) | 2,927 (89) |
86. Hawaii | 822 (78) | 586 (105) | 3,414 (34) | 400 (103) | 2,681 (93) |
87. Texas State | 994 (69) | 879 (74) | 2,893 (42) | 1,070 (58) | 2,022 (118) |
88. Iowa State | 3,033 (2) | 36 (122) | 1,820 (88) | 849 (70) | 1,495 (125) |
89. Alabama | 108 (127) | 645 (95) | 2,858 (44) | 1,426 (29) | 2,505 (99) |
90. New Mexico | 755 (83) | 534 (109) | 2,236 (68) | 583 (93) | 3,389 (76) |
91. Louisiana Tech | 827 (77) | 0 (138) | 1,483 (107) | 1,722 (18) | 3,378 (78) |
92. Fresno State | 78 (130) | 1,189 (45) | 2,213 (71) | 788 (76) | 2,973 (87) |
93. UAB | 220 (112) | 1,121 (50) | 2,496 (57) | 858 (68) | 2,533 (98) |
94. Boston College | 0 (136) | 1,086 (54) | 1,537 (105) | 1,157 (49) | 3,307 (79) |
95. Kennesaw State | 392 (100) | 1 (137) | 1,727 (92) | 207 (120) | 4,714 (51) |
96. Wake Forest | 1,347 (44) | 479 (116) | 2,396 (60) | 883 (66) | 1,931 (120) |
97. Washington State | 93 (128) | 992 (62) | 1,793 (89) | 1,253 (42) | 2,824 (90) |
98. Troy | 1,252 (47) | 477 (117) | 423 (137) | 774 (80) | 3,985 (67) |
99. Toledo | 199 (116) | 755 (85) | 2,215 (70) | 1,182 (46) | 2,557 (94) |
100. Utah State | 721 (84) | 1,071 (55) | 1,596 (100) | 117 (125) | 3,389 (76) |
101. Iowa | 172 (84) | 777 (81) | 1,594 (101) | 1,915 (14) | 2,322 (106) |
102. Oregon State | 1,541 (36) | 528 (111) | 528 (133) | 1,781 (17) | 2,232 (109) |
103. Georgia State | 399 (99) | 336 (125) | 1,166 (114) | 708 (75) | 3,838 (76) |
104. Missouri State | 1,208 (53) | 466 (118) | 3,098 (38) | 794 (75) | 676 (133) |
105. New Mexico State | 183 (118) | 819 (77) | 2,450 (58) | 504 (99) | 2,273 (107) |
106. Nevada | 768 (82) | 615 (99) | 1,099 (117) | 150 (123) | 3,517 (74) |
107. Eastern Michigan | 1,238 (51) | 1,258 (42) | 1,006 (120) | 711 (84) | 1,785 (121) |
108. Navy | 534 (93) | 322 (128) | 771 (126) | 807 (74) | 3,570 (73) |
109. Akron | 117 (124) | 981 (63) | 1,911 (86) | 710 (75) | 2,221 (110) |
110. Southern Miss | 1,481 (39) | 911 (70) | 1,279 (111) | 9 (136) | 2,080 (116) |
111. Louisiana Monroe | 1,247 (48) | 611 (101) | 1,540 (104) | 336 (112) | 1,962 (119) |
112. North Carolina | 1,053 (65) | 777 (81) | 1,753 (91) | 776 (79) | 1,293 (128) |
113. FIU | 450 (97) | 610 (102) | 1,492 (106) | 292 (117) | 2,732 (92) |
114. South Alabama | 1,149 (59) | 494 (113) | 1,093 (118) | 471 (100) | 2,332 (105) |
115. Kent State | 590 (90) | 640 (96) | 1,199 (112) | 398 (104) | 2,545 (96) |
116. Coastal Carolina | 111 (126) | 632 (97) | 1,577 (103) | 507 (97) | 2,464 (102) |
117. Rice | 570 (91) | 940 (66) | 1,160 (115) | 332 (113) | 2,236 (108) |
118. UMass | 207 (114) | 354 (123) | 1,722 (93) | 1,179 (47) | 1,780 (122) |
119. App State | 1,004 (67) | 1,129 (44) | 726 (128) | 63 (127) | 2,052 (117) |
120. Jacksonville State | 673 (87) | 501 (112) | 1,631 (96) | 63 (127) | 2,180 (112) |
121. Charlotte | 1,191 (56) | 490 (114) | 686 (130) | 977 (61) | 1,649 (124) |
122. UConn | 309 (103) | 781 (80) | 1,619 (97) | 50 (131) | 2,090 (114) |
123. Ball State | 68 (131) | 434 (120) | 1,640 (95) | 339 (111) | 2,375 (104) |
124. Colorado State | 240 (110) | 764 (84) | 2,331 (63) | 750 (83) | 742 (132) |
125. Wyoming | 113 (125) | 566 (108) | 870 (125) | 202 (121) | 2,931 (88) |
126. James Madison | 118 (123) | 673 (93) | 1,039 (119) | 21 (133) | 2,820 (91) |
127. Air Force | 943 (71) | 689 (91) | 482 (136) | 60 (129) | 2,495 (100) |
128. Northern Illinois | 354 (102) | 585 (106) | 2,350 (62) | 78 (126) | 1,253 (129) |
129. Sam Houston | 252 (108) | 1,166 (47) | 1,616 (98) | 225 (119) | 1,299 (127) |
130. Middle Tennessee | 258 (106) | 173 (133) | 2,028 (80) | 527 (96) | 1,475 (126) |
131. Buffalo | 17 (134) | 484 (115) | 2,639 (53) | 0 (137) | 874 (130) |
132. San Jose State | 304 (104) | 431 (121) | 619 (131) | 18 (134) | 2,085 (115) |
133. Bowling Green | 255 (107) | 450 (119) | 491 (134) | 756 (82) | 745 (131) |
134. Ohio | 201 (115) | 1,065 (56) | 1,172 (113) | 44 (132) | 209 (136) |
135. UTEP | 38 (133) | 910 (71) | 722 (129) | 325 (115) | 217 (135) |
136. Old Dominion | 441 (98) | 685 (92) | 483 (135) | 276 (118) | 220 (134) |
137. Sacramento State | 246 (109) | 11 (135) | 986 (121) | 147 (124) | 6 (137) |
138. North Dakota State | 0 (136) | 3 (136) | 0 (138) | 0 (137) | 4 (138) |
As noted at the beginning of this article, experience has become a strong predictor of success in the new age of college football. No position illustrates that more clearly than quarterback.
Seven of the last 10 national champions, including each of the past four, entered the season with a starting quarterback who had already accumulated at least 13 career starts and more than 900 career snaps.
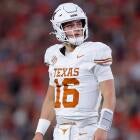
Finding that level of experience isn't particularly difficult with the transfer portal. There are 37 Power Four programs that enter 2026 with a quarterback on their roster who has already reached those marks. However, only 14 of those teams rank inside the top 25 of the CBS Sports 138: No. 2 Texas, No. 3 Oregon, No. 5 Georgia, No. 6 Indiana, No. 7 Miami, No. 8 Texas A&M, No. 10 Oklahoma, No. 12 Ole Miss, No. 13 LSU, No. 14 USC, No. 18 Penn State, No. 19 Washington, No. 20 SMU and No. 22 Utah.
If that trend holds, the 2026 national champion will likely emerge from that group.
Several of the top teams entering 2026, according to our panel of voters, are notable absences from that group, including No. 1 Ohio State, No. 4 Notre Dame, No. 9 Texas Tech and No. 11 Alabama. Ohio State's Julian Sayin and Notre Dame's CJ Carr both enter their second season as starters with fewer than 900 career snaps.
Offensive line experience is nearly as important. While quarterbacks often receive the most attention, offensive linemen account for at least five of the 11 players on the field on every offensive snap, making experience up front one of the most valuable assets an offense can have.
No team enters 2026 with more offensive line experience than Virginia, which also leads the country in total offensive snaps. Virginia and South Carolina are the only two programs in the FBS with at least 10,000 career offensive line snaps on their current rosters. UCLA, Oklahoma State and Nebraska round out the top five nationally in total offensive line snaps. All five programs also rank among the nation's 10 most experienced offenses entering 2026.
Rather than relying on sheer snap volume at one or two positions, a more complete picture comes from how experience is distributed across the entire offense. When averaging FBS ranks in career snaps across all five position groups -- quarterback, running back, wide receiver, tight end and offensive line -- a clear group of the most balanced, experienced offenses emerges. The five teams with the strongest overall balance of offensive experience are:
1. Houston — 13.8
2. UCLA — 16.4
3. Auburn — 16.6
4. Virginia — 18.2
5. Oklahoma — 19.4
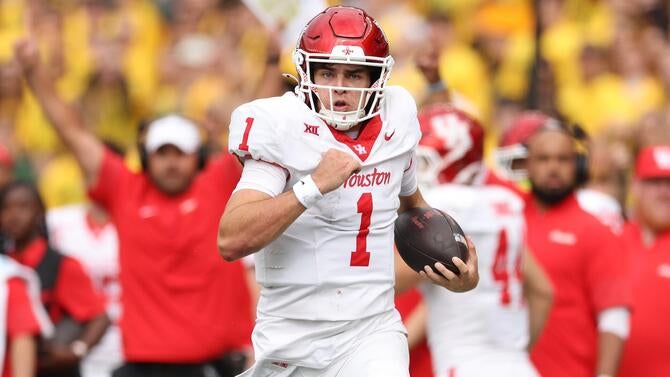
Houston is a potential Big 12 contender despite sitting just outside the top 25 of the CBS Sports 138. The Cougars are especially experienced at the skill positions, with the addition of running back Makhi Hughes, who reunites with Willie Fritz after their time together at Tulane. Houston added five other transfers with at least 700 career snaps, including offensive lineman Shadre Hurst, who ranks sixth nationally in career snaps. The Cougars also return seven starters on offense, led by quarterback Conner Weigman.
UCLA and Auburn enter 2026 with new coaching staffs that reshaped their offenses through the transfer portal. That overhaul on The Plains under Alex Golesh could translate into one of the most productive rushing attacks in the country. The Tigers feature a talented backfield duo in Jeremiah Cobb and Bryson Washington, a mobile quarterback in Byrum Brown, and a rebuilt offensive line that ranks 18th nationally in career snaps.
The Bruins' ranking is driven largely by transfer additions. UCLA added 12 transfers with at least 400 career snaps, including five former James Madison players who followed Bob Chesney to Los Angeles. Half of those most experienced newcomers are on the offensive line, an immediate attempt to stabilize a unit that struggled to protect Nico Iamaleava last season.
While those offenses listed above reflect balance and accumulated experience across the board, others enter 2026 with inexperience spread throughout the entire unit. These Power Four teams have the weakest average FBS rank in career snaps across all five position groups:
65. Michigan — 84.2
66. Iowa — 84.2
67. Boston College — 84.6
68. North Carolina — 88.8
69. TCU — 91.4
Enough about the offenses, let's get into defense.
Defense experience
Teams ranked in order of total defensive snaps
| Team | DL Snaps | Edge Snaps | LB Snaps | CB Snaps | SAF Snaps |
|---|---|---|---|---|---|
1. Texas Tech | 4,109 (2) | 3,361 (7) | 5,237 (1) | 4,037 (11) | 1,973 (68) |
2. Virginia | 2,785 (11) | 2,621 (27) | 2,087 (46) | 4,876 (3) | 5,914 (1) |
3. Oklahoma State | 3,055 (5) | 3,172 (11) | 4,212 (6) | 1,821 (78) | 5,388 (3) |
4. Vanderbilt | 4,349 (1) | 2,768 (19) | 2,844 (25) | 3,945 (15) | 2,786 (40) |
5. Ole Miss | 2,884 (9) | 4,444 (2) | 3,160 (19) | 2,994 (31) | 3,313 (27) |
6. Texas A&M | 2,490 (24) | 2,734 (21) | 1,943 (54) | 3,863 (17) | 5,680 (2) |
7. Tennessee | 1,585 (60) | 1,419 (80) | 4,791 (3) | 3,275 (29) | 4,427 (8) |
8. UCF | 2,302 (29) | 2,120 (45) | 3,934 (9) | 4,378 (8) | 2,696 (42) |
9. Miami | 2,505 (22) | 1,452 (79) | 3,067 (20) | 4,846 (4) | 3,099 (32) |
10. Kansas | 2,355 (28) | 1,993 (51) | 4,861 (2) | 2,611 (44) | 3,109 (31) |
11. Indiana | 2,657 (13) | 2,533 (31) | 1,996 (50) | 3,825 (18) | 3,872 (15) |
12. Arizona State | 2,357 (27) | 3,818 (3) | 2,656 (31) | 2,440 (56) | 3,352 (24) |
13. Penn State | 2,716 (12) | 1,388 (81) | 4,174 (7) | 4,129 (10) | 1,889 (69) |
14. SMU | 1,700 (56) | 3,625 (5) | 2,756 (29) | 3,823 (19) | 2,205 (59) |
15. UCLA | 1,317 (72) | 2,507 (33) | 1,981 (51) | 4,311 (9) | 3,939 (14) |
16. Virginia Tech | 793 (105) | 3,336 (8) | 1,257 (91) | 5,401 (1) | 3,255 (28) |
17. Houston | 2,185 (32) | 2,573 (30) | 3,579 (16) | 2,048 (71) | 3,515 (23) |
18. Notre Dame | 2,293 (30) | 1,513 (76) | 3,992 (8) | 3,744 (21) | 2,317 (52) |
19. Texas | 2,567 (18) | 2,460 (35) | 3,774 (13) | 2,597 (48) | 2,361 (48) |
20. Arizona | 735 (108) | 3,411 (6) | 3,585 (15) | 2,565 (53) | 3,322 (26) |
21. Wake Forest | 1,442 (66) | 2,824 (18) | 2,601 (32) | 3,267 (24) | 2,987 (34) |
22. BYU | 2,551 (19) | 1,621 (69) | 4,512 (4) | 2,602 (45) | 1,842 (71) |
23. Baylor | 3,515 (3) | 2,037 (48) | 2,026 (49) | 1,927 (75) | 3,759 (17) |
24. LSU | 2,143 (34) | 1,610 (70) | 3,927 (10) | 1,577 (89) | 3,980 (13) |
25. Florida | 2,627 (17) | 1,774 (61) | 2,394 (39) | 2,394 (58) | 3,722 (18) |
26. Washington | 1,798 (48) | 2,400 (37) | 4,403 (5) | 1,410 (95) | 3,050 (33) |
27. Colorado | 3,004 (6 | 1,202 (85) | 2,833 (26) | 4,428 (6) | 1,397 (94) |
28. Tulsa | 1,054 (83) | 2,640 (26) | 2,304 (40) | 5,166 (2) | 1,578 (86) |
29. Georgia | 1,687 (57) | 2,046 (47) | 2,055 (47) | 1,719 (84) | 5,206 (4) |
30. Auburn | 2,806 (10) | 1,511 (77) | 1,621 (76) | 2,341 (61) | 4,416 (9) |
31. Georgia Tech | 1,334 (70) | 2,913 (16) | 3,245 (17) | 4,414 (7) | 739 (122) |
32. Oregon | 3,200 (4) | 3,249 (9) | 1,679 (70) | 1,556 (93) | 2,942 (36) |
33. TCU | 2,657 (13) | 2,522 (32) | 614 (123) | 2,577 (50) | 3,992 (12) |
34. Miami (Ohio) | 2,507 (21) | 2,680 (23) | 3,244 (18) | 3,746 (20) | 154 (132) |
35. Maryland | 1,872 (44) | 1,553 (73) | 2,403 (37) | 4,523 (5) | 1,547 (87) |
36. Cincinnati | 618 (116) | 1,653 (65) | 3,689 (14) | 4,014 (12) | 2,117 (63) |
37. Stanford | 1,632 (59) | 2,720 (22) | 1,808 (60) | 2,208 (66) | 3,632 (21) |
38. Alabama | 2,637 (16) | 2,254 (41) | 1,354 (88) | 2,465 (55) | 3,249 (29) |
39. Mississippi State | 1,855 (45) | 2,022 (49) | 1,770 (65) | 1,743 (82) | 4,481 (7) |
40. Minnesota | 585 (119) | 5,257 (1) | 2,302 (41) | 1,275 (100) | 2,313 (53) |
41. Michigan | 1,684 (58) | 1,657 (64) | 1,158 (99) | 3,985 (13) | 3,249 (29) |
42. Louisville | 969 (88) | 3,725 (4) | 2,857 (23) | 2,484 (54) | 1,713 (76) |
43. Tulane | 2,492 (23) | 666 (116) | 2,578 (33) | 3,662 (23) | 2,360 (49) |
44. Florida State | 2,070 (38) | 2,008 (50) | 3,910 (11) | 1,916 (76) | 1,826 (74) |
45. Northwestern | 2,205 (31) | 1,653 (65) | 2,463 (36) | 3,681 (22) | 1,683 (78) |
46. Arkansas | 439 (125) | 1,297 (84) | 2,850 (24) | 2,279 (62) | 4,652 (6) |
47. Nebraska | 1,832 (47) | 3,135 (12) | 2,663 (30) | 2,205 (67) | 1,641 (81) |
48. Michigan State | 718 (110) | 2,163 (43) | 3,896 (12) | 2,376 (59) | 2,307 (54) |
49. Purdue | 2,415 (26) | 2,657 (25) | 1,946 (53) | 2,644 (42) | 1,773 (75) |
50. Pittsburgh | 2,539 (20) | 2,342 (38) | 2,937 (22) | 2,600 (46) | 972 (112) |
51. South Florida | 1,900 (41) | 1,926 (57) | 1,786 (64) | 1,960 (74) | 3,664 (19) |
52. Ohio State | 2,417 (25) | 2,614 (28) | 1,246 (92) | 2,052 (70) | 2,849 (39) |
53. Memphis | 2,132 (35) | 1,980 (52) | 721 (119) | 3,295 (28) | 2,927 (37) |
54. Clemson | 888 (100) | 2,760 (20) | 1,805 (61) | 2,683 (38) | 2,752 (41) |
55. California | 2,067 (39) | 2,941 (15) | 261 (134) | 2,665 (39) | 2,952 (35) |
56. Florida Atlantic | 1,738 (53) | 2,987 (15) | 2,766 (28) | 2,658 (41) | 713 (123) |
57. Georgia Southern | 2,646 (15) | 3,103 (13) | 1,073 (106) | 3,458 (26) | 347 (130) |
58. USC | 1,900 (41) | 2,660 (24) | 1,856 (58) | 2,754 (34) | 1,175 (104) |
59. Utah | 950 (93) | 2,595 (29) | 1,553 (79) | 2,944 (32) | 2,044 (65) |
60. Kennesaw State | 1,560 (61) | 1,950 (55) | 1,614 (77) | 2,573 (51) | 2,409 (47) |
61. West Virginia | 593 (117) | 2,168 (42) | 2,481 (35) | 3,595 (25) | 1,197 (103) |
62. Illinois | 1,376 (68) | 1,518 (75) | 1,037 (109) | 3,891 (16) | 2,181 (61) |
63. Kentucky | 2,158 (33) | 1,913 (58) | 483 (127) | 1,560 (92) | 3,823 (16) |
64. Utah State | 958 (91) | 1,579 (71) | 2,830 (27) | 2,272 (63) | 2,291 (56) |
65. Iowa State | 1,481 (65) | 1,686 (63) | 1,366 (87) | 1,586 (88) | 3,663 (20) |
66. Boston College | 963 (90) | 1,104 (93) | 958 (113) | 3,425 (27) | 3,338 (25) |
67. Oklahoma | 1,776 (50) | 1,571 (72) | 2,222 (44) | 2,104 (69) | 2,052 (64) |
68. San Diego State | 2,949 (7) | 1,524 (74) | 1,116 (104) | 474 (125) | 3,623 (22) |
69. New Mexico State | 702 (111) | 2,825 (17) | 2,401 (38) | 1,021 (107) | 2,654 (44) |
70. New Mexico | 857 (101) | 1,148 (88) | 1,140 (101) | 2,041 (72) | 4,390 (10) |
71. FIU | 1,710 (54) | 1,136 (90) | 1,470 (101) | 931 (110) | 4,152 (11) |
72. South Carolina | 2,092 (36) | 1,637 (67) | 1,791 (63) | 2,665 (39) | 1,170 (105) |
73. Wisconsin | 1,787 (49) | 2,304 (40) | 1,025 (111) | 2,015 (73) | 2,157 (62) |
74. Syracuse | 1,081 (81) | 2,418 (36) | 1,613 (78) | 2,721 (35) | 1,375 (96) |
75. Boise State | 1,014 (85) | 3,194 (10) | 1,441 (84) | 3,193 (30) | 360 (129) |
76. Rutgers | 2,898 (8) | 2,157 (44) | 2,300 (42) | 631 (119) | 1,211 (102) |
77. Kansas State | 456 (124) | 1,961 (54) | 1,981 (51) | 2,760 (33) | 2,021 (66) |
78. Arkansas State | 1,310 (74) | 487 (123) | 1,738 (67) | 596 (121) | 4,750 (5) |
79. Liberty | 1,849 (46) | 1,304 (83) | 1,628 (74) | 1,566 (91) | 2,216 (58) |
80. NC State | 1,058 (82) | 2,071 (46) | 748 (118) | 2,229 (65) | 2,254 (57) |
81. North Texas | 1,163 (79) | 2,320 (39) | 1,707 (69) | 1,741 (83) | 1,249 (101) |
82. Texas State | 1,415 (67) | 636 (117) | 1,894 (57) | 2,582 (49) | 1,590 (85) |
83. Old Dominion | 1,313 (73) | 412 (128( | 2,576 (34) | 1,606 (85) | 2,198 (60) |
84. Colorado State | 1,895 (43) | 1,964 (53) | 1,329 (89) | 564 (122) | 2,305 (55) |
85. Fresno State | 1,974 (40) | 1,945 (56) | 865 (116) | 2,272 (63) | 996 (111) |
86. UNLV | 764 (106) | 432 (127) | 1,279 (90) | 3,956 (14) | 1,491 (90) |
87. UConn | 1,749 (51) | 2,501 (34) | 1,834 (59) | 408 (128) | 1,444 (93) |
88. Duke | 1,016 (84) | 944 (101) | 2,033 (48) | 2,142 (68) | 1,470 (91) |
89. North Carolina | 1,708 (55) | 337 (130) | 1,542 (81) | 2,566 (52) | 1,250 (100) |
90. Jacksonville State | 1,254 (77) | 1,624 (68) | 2,236 (43) | 1,305 (99) | 969 (113) |
91. Rice | 1,509 (63) | 807 (111) | 1,168 (97) | 1,390 (96) | 2,327 (51) |
92. Eastern Michigan | 797 (104) | 1,741 (62) | 1,734 (68) | 1,324 (98) | 1,629 (83) |
93. Missouri | 956 (92) | 1,159 (87) | 1,162 (98) | 2,633 (43) | 1,275 (99) |
94. Coastal Carolina | 988 (87) | 936 (103) | 3,024 (21) | 599 (120) | 1,520 (89) |
95. UTSA | 1,742 (52) | 909 (105) | 1,930 (56) | 1,601 (86) | 871 (115) |
96. Air Force | 695 (113) | 727 (113) | 1,933 (55) | 1,108 (103) | 2,423 (46) |
97. Marshall | 329 (129) | 586 (118) | 938 (115) | 1,784 (79) | 2,925 (38) |
98. Hawaii | 341 (128) | 978 (99) | 1,633 (73) | 2,710 (36) | 767 (121) |
99. Navy | 1,319 (71) | 7 (137) | 1,797 (62) | 1,774 (80) | 1,539 (88) |
100. Washington State | 901 (97) | 1,839 (59) | 1,063 (108) | 1,201 (102) | 1,323 (97) |
101. East Carolina | 854 (102) | 1,460 (78) | 1,196 (94) | 1,063 (105) | 1,599 (84) |
102. Oregon State | 1,541 (62) | 496 (122) | 1,430 (85) | 2,598 (47) | 100 (133) |
103. Troy | 1,227 (78) | 583 (120) | 1,753 (66) | 651 (117) | 1,868 (70) |
104. Akron | 728 (109) | 984 (98) | 718 (120) | 540 (123) | 2,664 (43) |
105. Delaware | 620 (115) | 903 (107) | 1,667 (71) | 1,011 (108) | 1,391 (95) |
106. Nevada | 917 (95) | 1,796 (60) | 284 (132) | 1,753 (81) | 820 (116) |
107. UTEP | 585 (119) | 978 (99) | 1,153 (100) | 1,107 (104) | 1,646 (80) |
108. Ohio | 1,487 (64) | 383 (129) | 1,184 (95) | 738 (115) | 1,658 (79) |
109. Western Kentucky | 750 (107) | 1,110 (92) | 410 (130) | 684 (116) | 2,451 (45) |
110. Charlotte | 2,075 (37) | 728 (112) | 1,369 (86) | 754 (114) | 492 (125) |
111. Louisiana | 1,306 (75) | 869 (109) | 701 (121) | 973 (109) | 1,465 (92) |
112. Ball State | 890 (99) | 828 (110) | 390 (131) | 2,405 (57) | 775 (119) |
113. UAB | 897 (98) | 1,064 (94) | 1,110 (105) | 1,889 (77) | 245 (131) |
114. Missouri State | 592 (118) | 1,139 (89) | 1,035 (110) | 475 (124) | 1,829 (72) |
115. Western Michigan | 702 (111) | 328 (132) | 556 (124) | 2,362 (60) | 1,069 (108) |
116. Iowa | 403 (127) | 586 (118) | 506 (126) | 2,708 (37) | 791 (118) |
117. Louisiana Monroe | 995 (86) | 480 (125) | 1,178 (96) | 1,026 (106) | 1,291 (98) |
118. App State | 235 (132) | 933 (104) | 1,133 (102) | 1,599 (87) | 1,041 (110) |
119. Kent State | 966 (89) | 486 (124) | 1,642 (72) | 183 (133) | 1,632 (82) |
120. UMass | 329 (129) | 281 (133) | 1,550 (80) | 365 (131) | 2,348 (50) |
121. Wyoming | 1,360 (69) | 336 (131) | 679 (122) | 407 (129) | 2,004 (67) |
122. Temple | 462 (123) | 497 (121) | 1,625 (75) | 450 (126) | 1,707 (77) |
123. Sam Houston | 1,288 (76) | 678 (115) | 787 (117) | 928 (111) | 1,055 (109) |
124. Louisiana Tech | 149 (134) | 1,127 (91) | 2,104 (45) | 797 (113) | 464 (126) |
125. James Madison | 926 (94) | 902 (108) | 1,485 (82) | 645 (118) | 563 (124) |
126. Middle Tennessee | 557 (121) | 1,011 (97) | 465 (129) | 1,483 (94) | 803 (117) |
127. Bowling Green | 430 (126) | 1,031 (96) | 547 (125) | 434 (127) | 1,827 (73) |
128. Buffalo | 906 (96) | 54 (135) | 1,128 (103) | 1,369 (97) | 773 (120) |
129. Army | 1,084 (80) | 941 (102) | 75 (137) | 1,567 (90) | 394 (127) |
130. San Jose State | 825 (103) | 1,371 (82) | 1,227 (93) | 182 (134) | 41 (136) |
131. South Alabama | 195 (133) | 1,054 (95) | 941 (114) | 171 (135) | 1,170 (105) |
132. Toledo | 143 (135) | 907 (106) | 1,067 (107) | 35 (138) | 1,155 (107) |
133. Central Michigan | 658 (114) | 709 (114) | 265 (133) | 1,236 (101) | 388 (128) |
134. Georgia State | 79 (137) | 1,200 (86) | 482 (128) | 223 (132) | 899 (114) |
135. Southern Miss | 478 (122) | 92 (134) | 986 (112) | 872 (112) | 51 (135) |
136. Northern Illinois | 87 (136) | 464 (126) | 140 (135) | 394 (130) | 52 (134) |
137. Sacramento State | 245 (131) | 52 (136) | 112 (136) | 83 (136) | 34 (137) |
138. North Dakota State | 0 (138) | 0 (138) | 0 (138) | 83 (136) | 0 (138) |
Texas Tech enters 2026 with the most experienced defense in the FBS, built largely through aggressive roster retention and targeted transfer additions. The Red Raiders effectively used the portal to reinforce a unit that once again projects as one of the most veteran groups in the country.
The one potential soft spot comes at safety. While the rest of the defense is loaded with experienced contributors, returning starter Brenden Jordan is the only player at the position with at least 250 career defensive snaps, leaving safety as the only Texas Tech position group that ranks outside the top 12 nationally in combined experience.
Across all five defensive position groups -- defensive line, edge, linebacker, cornerback and safety -- the same five programs that lead the overall defensive experience rankings also occupy the top five spots when averaging positional experience rankings.
1. Virginia — 17.6
1. Ole Miss — 17.6
3. Texas Tech — 17.8
4. Vanderbilt — 20.0
5. Oklahoma State — 20.6
Virginia stands out in particular because it ranks among the top five nationally on both offense and defense when averaging positional experience across each side of the ball. The other four listed above -- as well as Houston, SMU, Texas and UCLA -- are in the top 15 of both.
The Cavaliers have the most experienced secondary by far, with 10,790 combined career snaps among its cornerbacks and safeties, 1,247 more than the next-closest program, Texas A&M. The Cavaliers also lead the FBS with nine defensive backs who have accumulated at least 500 career snaps, more than any other team in the country and roughly double the Power Four average (4.4).
Now for the Power Four teams with the worst average FBS ranking across the five position groups.
65. Boston College — 69.6
66. NC State — 73.6
67. Duke — 78.4
68. North Carolina — 83.6
69. Iowa — 105.2
It is not an encouraging outlook for the Carolina Triangle. Those three programs combine for just two position groups that rank among the top 50 nationally in career snaps: NC State's edge rushers (2,071) and Duke's linebackers (2,033).
And then there's Iowa, the only Power Four program with four defensive position groups ranking 100th or worse nationally in career snaps.
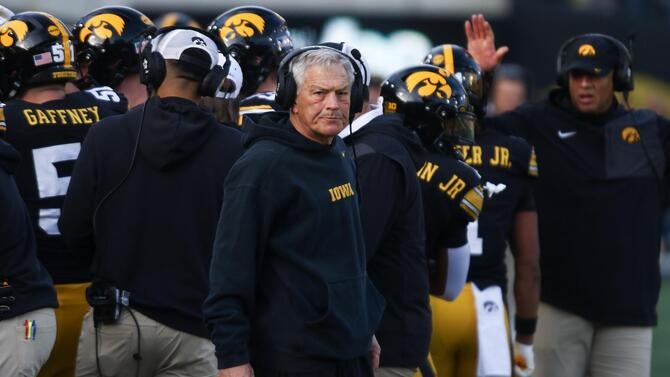
The Hawkeyes' defensive experience is concentrated at cornerback, the lone position group that ranks above the bottom quartile nationally and one that accounts for 54% of the roster's total defensive snaps. In fact, the three cornerbacks with starting experience -- Deshaun Lee, Zach Lutmer and Jaylen Watson -- have more career FBS snaps than the rest of Iowa's defensive roster combined.
Snaps alone don't tell us the whole picture of how good these rosters actually are. In the coming weeks, we'll examine which FBS rosters stocked the most proven production. First, the offensive side -- tracking passing efficiency, rush production, receiving explosiveness and how well offensive lines actually protected their quarterbacks. Then the defense, where we'll measure whether all those accumulated snaps translated into tackles, pressures, turnovers and havoc.
Experience may explain who is best positioned entering 2026. Production will help determine who is actually built to win.